 Contingency table
Note: since the start of probabilistic thunderstorm forecasts in 2009, the scores reported in the maps on this page are no longer accurate. The script needs to be adapted to the new forecasts.
An essential aspect of weather forecasting practice is verification: the comparison of the weather that was forecast with that which occurred. Estofex is developing verification methods so that the quality of the forecasts can be assessed while indicating where improvement is most urgently needed. The results of the verification analyses are published here.
Presently, as a first step, the accuracy of ESTOFEX's thunderstorm forecasts (the yellow line on the map) is being assessed quantitatively. The data used for this procedure originates from EUCLID, and before 1 January 2008 from the U.K. Met. Office's arrival time difference (ATD) lightning detection system. Some results are shown and described below. For the future, objective verification of hail, tornado and convective severe wind forecasts with ESWD data are planned.
Currently, ESTOFEX forecasts lightning in a dichotomous way: forecasters indicate in which areas they think lightning will occur and in which areas it will not. The yellow line on the forecast maps marks the boundary between the two areas.
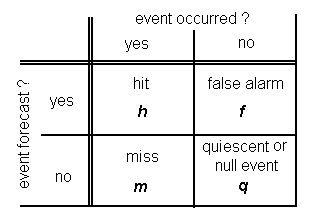
For formal verification it is necessary to define precisely when a lightning event can be said to have occurred at a given point. We have decided to use the criterion that lightning should have been recorded within 40 kilometres of the point. For dichotomous forecasts (i.e. yes-or-no forecasts), a standard way of verification, that is employed here, makes use of contingency tables. These are 2x2 tables that show how often the following four possibilities occurred:
a hit, positive forecast and positive result (i.e. lightning was forecast and did occur)
a miss, negative forecast and positive result (i.e. lightning was not forecast but did occur)
a false alarm, positive forecast and negative result (i.e. lightning was forecast but did not occur)
a quiescent event, negative forecast and negatve result (i.e. lightning was not forecast and did not occur)
Contingency table
For a large number of points spread around the forecast area, the four elements h, m ,f and q in the contingency table have been calculated. Based on those four numbers several quatities can be calculated that give particular information about the forecasts.
false alarm ratio, FAR = f / (h + f). The fraction of positive forecasts that turned out to be incorrect.
probability of detection, POD = h / (h + m). The fraction of positive events that was correctly forecast.
The shown data is based on all storm forecasts issued since 30 April 2006 and is updated daily. The data should be considered preliminary.
The number of positive forecasts (i.e. that lightning will occur) issued at each point, h + f.
The number of positive outcomes at each point (i.e. lightning did occur), h + m.
The number of misses at each point (i.e. lightning did occur, but was not forecast), m.
The number of false alarms at each point (i.e. lightning was forecast, but did not occur), f.
The false alarm rate (FAR, see above) at each point (multiplied by 10, i.e. 8 means 0.8).
The probability of detection (POD, see above) at each point (multiplied by 10, i.e. 8 means 0.8).