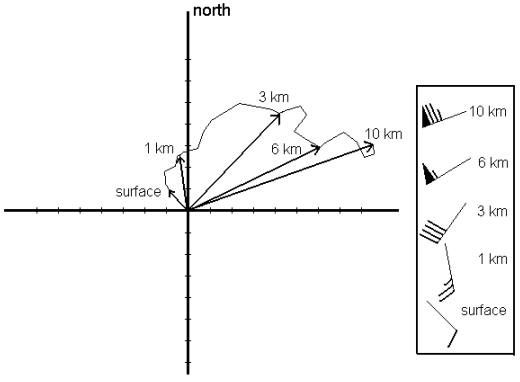
Fig. 1.15. An example hodograph corresponding with the wind vectors shown on the right.
The vertical wind profile can conveniently be displayed using a hodograph (fig. 1.15). A hodograph is a curve (u(z), v(z)) that can be constructed by following the tips of the wind vectors when ascending through the atmosphere. The average wind between the surface and 6 kilometres above the surface is a good estimate of the motion a non-splitting storm cell would have. As has been mentioned before, the motion of an entire storm cluster will usually deviate from that in the opposite direction of the low level shear.
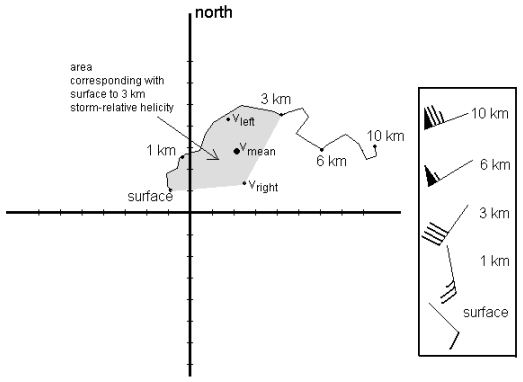
Fig. 1.16. A hodograph and the motion of the mean wind, the left- and right-moving storms plotted on it as well a shaded area corresponding to 0-3 km storm-relative helicity for a right-moving storm.
A hodograph can help determine that direction. Splitting storms deviate on average about 7.5 m/s to the left and right of the mean wind (see fig. 1.16 ). The area bounded by 1) a line from the storm motion dot to the surface wind, 2) the hodograph up to 3 km and 3) a line back, is proportional to the 0-3 km storm-relative helicity available to a storm following that motion. In fig. this is done for the right-moving storm. If we would do the same for the left-moving storm, the area would be much smaller. We can conclude that the right-moving storm has more storm-relative helicity with this hodograph than the left-moving storm. As a result, the right-moving storm will be more inclined to rotate and also experience a large updraft-enhancing vertical pressure gradient. It is generally true that:
a clockwise-turning hodograph favours right-moving storms
an anticlockwise turning hodograph favours left-moving storms
straight hodographs favour each as much
When expressed in numbers, 150 m2s2 is considered somewhat favourable for supercells, while 250 m2s2 or more is very favourable. 0-3 km helicity is a much less useful as a predictor for tornadoes than it is for supercells. Research has shown that helicity in the 0-1 km layer has some skill in predicting tornadoes (Rasmussen, 2003), given the situation that supercells have formed (see section on tornadoes, below).
When convection is elevated (see 1.2.4) it is no use to look at the storm-relative helicity of the flow below the layer that supplies the air for the convective updraft. This is particularly important, as winds over a cold pool or frontal zone often back strongly with height and high helicity values usually are then commonly observed. As long as the air below is too cool to enter the storm one does not need to consider the possibility of supercells. Elevated supercells are however possible when high helicity is available in and above the layer that feeds the storms.